Hi,
i read on the internet that there is no charts webpart in SharePoint 2013 so i had created a visual webpart to display Pie Chart from SharePoint List with all the configurable properties
Note: i’m using Google API to create Charts
here are the webpart configurable properties
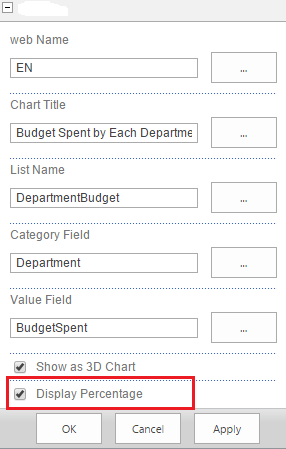
We can display it as a 3D or 2D just only we need to check the above property, also we can display actual number/values instead of percentage, see the above properties
Note: you can apply other Pie Chart styles by reading out the Google API
here is the DepartmentBudget List in SharePoint

After adding a webpart you can see the following two Pie Charts, one with 3D and other one with 2D
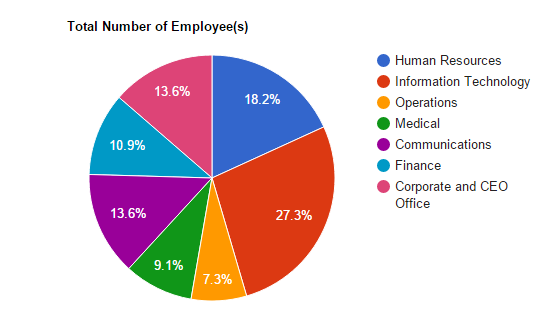
Now see 3D Pie Chart
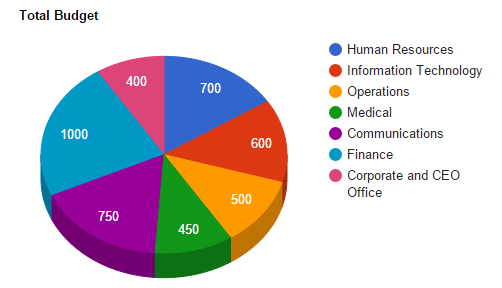
Chart with actual values
i’m using the following code
.ascx Page
<asp:Label ID="lblError" runat="server"></asp:Label>

<script type="text/javascript" src="https://www.google.com/jsapi?autoload={'modules':[{'name':'visualization','version':'1.1','packages':['corechart']}]}"></script>
<div>
    <asp:Literal ID="ltrlScript" runat="server"></asp:Literal>
    <asp:Literal ID="ltrlCharts" runat="server"></asp:Literal>
</div>
Css Class
.PieChartCustomDepartment {
        width:725px;
        height:400px;
    }
.ascx.cs Page
#region All Custom Properties

        [WebBrowsable(true),
                  Category("Custom"),
                  Personalizable(PersonalizationScope.Shared),
                  WebDisplayName("web Name"),
                  WebDescription("web url")]
        public string webName { get; set; }

        [WebBrowsable(true),
                  Category("Custom"),
                  Personalizable(PersonalizationScope.Shared),
                  WebDisplayName("Chart Title"),
                  WebDescription("Title of the Chart")]
        public string ChartTitle { get; set; }

        [WebBrowsable(true),
                  Category("Custom"),
                  Personalizable(PersonalizationScope.Shared),
                  WebDisplayName("List Name"),
                  WebDescription("List name of department budget")]
        public string ListName { get; set; }

        [WebBrowsable(true),
                  Category("Custom"),
                  Personalizable(PersonalizationScope.Shared),
                  WebDisplayName("Category Field"),
                  WebDescription("Category Field Name")]
        public string CategoryField { get; set; }

        [WebBrowsable(true),
                  Category("Custom"),
                  Personalizable(PersonalizationScope.Shared),
                  WebDisplayName("Value Field"),
                  WebDescription("Field Name of which you want to generate chart")]
        public string ValueField { get; set; }

        [WebBrowsable(true),
                  Category("Custom"),
                  Personalizable(PersonalizationScope.Shared),
                  WebDisplayName("Show as 3D Chart"),
                  WebDescription("flag to display chart in 3D or in 2D")]
        public bool ShowAs3DChart { get; set; }

        #endregion

        public vwPieChartCustom()
        {
        }

        protected override void OnInit(EventArgs e)
        {
            base.OnInit(e);
            InitializeControl();
        }

        protected void Page_Load(object sender, EventArgs e)
        {
            try
            {
                if (!Page.IsPostBack)
                {
                    CreateDepartmentPieChart();
                }
            }
            catch (Exception ex)
            {
                lblError.Text = ex.Message;
            }

            this.ChromeType = PartChromeType.None;
        }

        private void CreateDepartmentPieChart()
        {
            SPListItemCollection itemsColl = GetAllItemsByBudget();
            if (itemsColl != null && itemsColl.Count > 0)
            {
                StringBuilder script = new StringBuilder();

                script.AppendLine("<script type=\"text/javascript\">");
                script.AppendLine("google.load(\"visualization\", \"1\", {packages:[\"corechart\"]});");
                script.AppendLine("google.setOnLoadCallback(drawChart);");
                script.AppendLine("function drawChart() {");
                script.AppendLine(" var data = google.visualization.arrayToDataTable([");
                script.AppendLine(" ['" + CategoryField + "', '" + ValueField + "'],");
                for (int i = 0; i < itemsColl.Count; i++)
                {
                    script.AppendLine(" ['" + itemsColl[i][CategoryField] + "', " + itemsColl[i][ValueField] + "],");
                }
                script.AppendLine(" ]);");

                script.AppendLine(" var options = {");
               if (ShowAs3DChart)
 {
 script.AppendLine(" title: '" + ChartTitle + "',");
 if (DisplayPercentage)
 {
 script.AppendLine(" pieSliceText:'percentage',");
 }
 else
 {
 script.AppendLine(" pieSliceText:'value',");
 }
 script.AppendLine(" is3D: true");
 }
 else
 {
 script.AppendLine(" title: '" + ChartTitle + "',");
 script.AppendLine(" pieSliceText:'value'");
 }
                script.AppendLine(" };");

                StringBuilder chartDiv = new StringBuilder();
                chartDiv.AppendLine(" <div id=\"PieChartDiv_" + ValueField + "\" class=\"PieChartCustomDepartment\" ></div>");
                script.AppendLine(" var chart = new google.visualization.PieChart(document.getElementById('PieChartDiv_" + ValueField + "'));");
                script.AppendLine(" chart.draw(data, options);");
                script.AppendLine(" }");
                script.AppendLine(" </script>");

                ltrlCharts.Text = chartDiv.ToString();
                ltrlScript.Text = script.ToString();
            }
        }

        private SPListItemCollection GetAllItemsByBudget()
        {
            SPListItemCollection listItems = null;
            try
            {
                SPWeb currentWeb = null;
                if (!string.IsNullOrEmpty(webName))
                {
                    currentWeb = SPContext.Current.Site.AllWebs[webName];
                }
                SPQuery query = new SPQuery();
                SPList list = currentWeb.Lists.TryGetList(ListName);
                if (list != null)
                {
                    listItems = list.GetItems(query);
                }
            }
            catch (Exception ex)
            {
                throw ex;
            }
            return listItems;
        }
For Ref: Click here
