Monthly Archives: September 2015

Create Bar Chart from SharePoint 2013 List

Guys,

today i had also created a Bar Chart using Google API in SharePoint 2013 by creating a Custom WebPart.

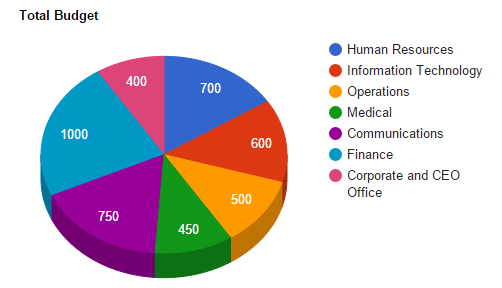
here is my custom SharePoint List (DepartmentBudget)

list updated


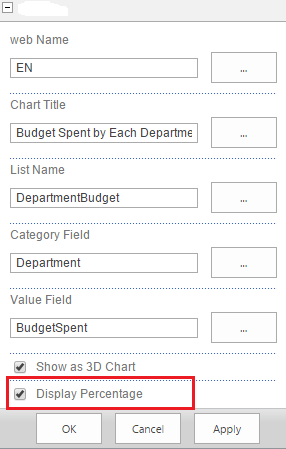
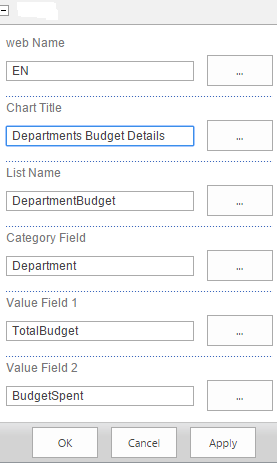
see the webpart Properties

webpart-properties-bar-chart


BAR Chart

bar Chart

CSS class

.BarChartDepartment
    {
	 width:100%;
     height:500px;
     }

.ascx Page

<asp:Label ID="lblError" runat="server"></asp:Label>

<script type="text/javascript" src="https://www.google.com/jsapi?autoload={'modules':[{'name':'visualization','version':'1.1','packages':['bar']}]}"></script>
<div>
    <asp:Literal ID="ltrlScript" runat="server"></asp:Literal>
    <asp:Literal ID="ltrlCharts" runat="server"></asp:Literal>
</div>

.ascx.cs Page

#region All Custom Properties

        [WebBrowsable(true),
                  Category("Custom"),
                  Personalizable(PersonalizationScope.Shared),
                  WebDisplayName("web Name"),
                  WebDescription("web url")]
        public string webName { get; set; }

        [WebBrowsable(true),
                  Category("Custom"),
                  Personalizable(PersonalizationScope.Shared),
                  WebDisplayName("Chart Title"),
                  WebDescription("Title of the Chart")]
        public string ChartTitle { get; set; }

        [WebBrowsable(true),
                  Category("Custom"),
                  Personalizable(PersonalizationScope.Shared),
                  WebDisplayName("List Name"),
                  WebDescription("List name of department budget")]
        public string ListName { get; set; }

        [WebBrowsable(true),
                  Category("Custom"),
                  Personalizable(PersonalizationScope.Shared),
                  WebDisplayName("Category Field"),
                  WebDescription("Category Field Name")]
        public string CategoryField { get; set; }

        [WebBrowsable(true),
                  Category("Custom"),
                  Personalizable(PersonalizationScope.Shared),
                  WebDisplayName("Value Field 1"),
                  WebDescription("Field Name of which you want to generate chart")]
        public string ValueField1 { get; set; }

        [WebBrowsable(true),
                  Category("Custom"),
                  Personalizable(PersonalizationScope.Shared),
                  WebDisplayName("Value Field 2"),
                  WebDescription("Field Name of which you want to generate chart")]
        public string ValueField2 { get; set; }

        #endregion

		protected void Page_Load(object sender, EventArgs e)
        {
            try
            {
                if (!Page.IsPostBack)
                {
                    CreateDepartmentPieChart();
                }
            }
            catch (Exception ex)
            {
                lblError.Text = ex.Message;
            }

            this.ChromeType = PartChromeType.None;
        }

        private void CreateDepartmentPieChart()
        {
            SPListItemCollection itemsColl = GetAllItemsByBudget();
            if (itemsColl != null && itemsColl.Count > 0)
            {
                StringBuilder script = new StringBuilder();

                script.AppendLine("<script type=\"text/javascript\">");
                script.AppendLine("google.load(\"visualization\", \"1\", {packages:[\"corechart\"]});");
                script.AppendLine("google.setOnLoadCallback(drawChart);");
                script.AppendLine("function drawChart() {");
                script.AppendLine(" var data = google.visualization.arrayToDataTable([");
                script.AppendLine(" ['" + CategoryField + "', '" + ValueField1 + "', '" + ValueField2 + "'],");
                for (int i = 0; i < itemsColl.Count; i++)
                {
                    script.AppendLine(" ['" + itemsColl[i][CategoryField] + "', " + itemsColl[i][ValueField1] + ", "+ itemsColl[i][ValueField2] + "],");
                }
                script.AppendLine(" ]);");

                script.AppendLine(" var options = {");
                script.AppendLine("chart:{");
                script.AppendLine(" title: '" + ChartTitle + "'");
                script.AppendLine(" },");
                script.AppendLine(" bars:'vertical',");
                script.AppendLine(" vAxis:{format:'decimal'},");
                script.AppendLine(" colors:['green','red']");

                script.AppendLine(" };");

                StringBuilder chartDiv = new StringBuilder();
                chartDiv.AppendLine(" <div id=\"BarChartDiv_" + ValueField1 + "\" class=\"BarChartDepartment\" ></div>");
                script.AppendLine(" var chart = new google.charts.Bar(document.getElementById('BarChartDiv_" + ValueField1 + "'));");
                script.AppendLine(" chart.draw(data, google.charts.Bar.convertOptions(options));");
                script.AppendLine(" }");
                script.AppendLine(" </script>");

                ltrlCharts.Text = chartDiv.ToString();
                ltrlScript.Text = script.ToString();
            }
        }

        private SPListItemCollection GetAllItemsByBudget()
        {
            SPListItemCollection listItems = null;
            try
            {
                SPWeb currentWeb = null;
                if (!string.IsNullOrEmpty(webName))
                {
                    currentWeb = SPContext.Current.Site.AllWebs[webName];
                }
                SPQuery query = new SPQuery();
                SPList list = currentWeb.Lists.TryGetList(ListName);
                if (list != null)
                {
                    listItems = list.GetItems(query);
                }
            }
            catch (Exception ex)
            {
                throw ex;
            }
            return listItems;
        }

For Ref: Bar Chart

Creating a Pie Chart from SharePoint 2013 List

Hi,

i read on the internet that there is no charts webpart in SharePoint 2013 so i had created a visual webpart to display Pie Chart from SharePoint List with all the configurable properties

Note: i’m using Google API to create Charts

here are the webpart configurable properties

percentage-property


We can display it as a 3D or 2D just only we need to check the above property, also we can display actual number/values instead of percentage, see the above properties

Note: you can apply other Pie Chart styles by reading out the Google API

here is the DepartmentBudget List in SharePoint

List

After adding a webpart you can see the following two Pie Charts, one with 3D and other one with 2D

2D


Now see 3D Pie Chart

3D


Chart with actual values

Percentage and value - Copy


i’m using the following code

.ascx Page

<asp:Label ID="lblError" runat="server"></asp:Label>

<script type="text/javascript" src="https://www.google.com/jsapi?autoload={'modules':[{'name':'visualization','version':'1.1','packages':['corechart']}]}"></script>
<div>
    <asp:Literal ID="ltrlScript" runat="server"></asp:Literal>
    <asp:Literal ID="ltrlCharts" runat="server"></asp:Literal>
</div>

Css Class

.PieChartCustomDepartment {
        width:725px;
        height:400px;
    }

.ascx.cs Page

#region All Custom Properties

        [WebBrowsable(true),
                  Category("Custom"),
                  Personalizable(PersonalizationScope.Shared),
                  WebDisplayName("web Name"),
                  WebDescription("web url")]
        public string webName { get; set; }

        [WebBrowsable(true),
                  Category("Custom"),
                  Personalizable(PersonalizationScope.Shared),
                  WebDisplayName("Chart Title"),
                  WebDescription("Title of the Chart")]
        public string ChartTitle { get; set; }

        [WebBrowsable(true),
                  Category("Custom"),
                  Personalizable(PersonalizationScope.Shared),
                  WebDisplayName("List Name"),
                  WebDescription("List name of department budget")]
        public string ListName { get; set; }

        [WebBrowsable(true),
                  Category("Custom"),
                  Personalizable(PersonalizationScope.Shared),
                  WebDisplayName("Category Field"),
                  WebDescription("Category Field Name")]
        public string CategoryField { get; set; }

        [WebBrowsable(true),
                  Category("Custom"),
                  Personalizable(PersonalizationScope.Shared),
                  WebDisplayName("Value Field"),
                  WebDescription("Field Name of which you want to generate chart")]
        public string ValueField { get; set; }

        [WebBrowsable(true),
                  Category("Custom"),
                  Personalizable(PersonalizationScope.Shared),
                  WebDisplayName("Show as 3D Chart"),
                  WebDescription("flag to display chart in 3D or in 2D")]
        public bool ShowAs3DChart { get; set; }

        #endregion

        public vwPieChartCustom()
        {
        }

        protected override void OnInit(EventArgs e)
        {
            base.OnInit(e);
            InitializeControl();
        }

        protected void Page_Load(object sender, EventArgs e)
        {
            try
            {
                if (!Page.IsPostBack)
                {
                    CreateDepartmentPieChart();
                }
            }
            catch (Exception ex)
            {
                lblError.Text = ex.Message;
            }

            this.ChromeType = PartChromeType.None;
        }

        private void CreateDepartmentPieChart()
        {
            SPListItemCollection itemsColl = GetAllItemsByBudget();
            if (itemsColl != null && itemsColl.Count > 0)
            {
                StringBuilder script = new StringBuilder();

                script.AppendLine("<script type=\"text/javascript\">");
                script.AppendLine("google.load(\"visualization\", \"1\", {packages:[\"corechart\"]});");
                script.AppendLine("google.setOnLoadCallback(drawChart);");
                script.AppendLine("function drawChart() {");
                script.AppendLine(" var data = google.visualization.arrayToDataTable([");
                script.AppendLine(" ['" + CategoryField + "', '" + ValueField + "'],");
                for (int i = 0; i < itemsColl.Count; i++)
                {
                    script.AppendLine(" ['" + itemsColl[i][CategoryField] + "', " + itemsColl[i][ValueField] + "],");
                }
                script.AppendLine(" ]);");

                script.AppendLine(" var options = {");
               if (ShowAs3DChart)
 {
 script.AppendLine(" title: '" + ChartTitle + "',");
 if (DisplayPercentage)
 {
 script.AppendLine(" pieSliceText:'percentage',");
 }
 else
 {
 script.AppendLine(" pieSliceText:'value',");
 }
 script.AppendLine(" is3D: true");
 }
 else
 {
 script.AppendLine(" title: '" + ChartTitle + "',");
 script.AppendLine(" pieSliceText:'value'");
 }
                script.AppendLine(" };");

                StringBuilder chartDiv = new StringBuilder();
                chartDiv.AppendLine(" <div id=\"PieChartDiv_" + ValueField + "\" class=\"PieChartCustomDepartment\" ></div>");
                script.AppendLine(" var chart = new google.visualization.PieChart(document.getElementById('PieChartDiv_" + ValueField + "'));");
                script.AppendLine(" chart.draw(data, options);");
                script.AppendLine(" }");
                script.AppendLine(" </script>");

                ltrlCharts.Text = chartDiv.ToString();
                ltrlScript.Text = script.ToString();
            }
        }

        private SPListItemCollection GetAllItemsByBudget()
        {
            SPListItemCollection listItems = null;
            try
            {
                SPWeb currentWeb = null;
                if (!string.IsNullOrEmpty(webName))
                {
                    currentWeb = SPContext.Current.Site.AllWebs[webName];
                }
                SPQuery query = new SPQuery();
                SPList list = currentWeb.Lists.TryGetList(ListName);
                if (list != null)
                {
                    listItems = list.GetItems(query);
                }
            }
            catch (Exception ex)
            {
                throw ex;
            }
            return listItems;
        }


For Ref: Click here

Migrate InfoPath Forms and SharePoint Designer 2013 Workflows

Hello Everyone,

Today’s i’m gonna add very interesting thing in my blog, in each organization we have some InfoPath Forms like Leave Request, Business Card, Expense Claim and different types of Allowance and so on….

we had developed some InfoPath forms using InfoPath 2013 and using Workflows of SharePoint Designer 2013.

also i’ve successfully migrated all the forms from Development to Production, here is full detail how one can do this important task.

Note: make sure you have installed SharePoint Workflow Manager 2013 on the server where you want to migrate forms, if there is any pre requisities required install them also.

for our scenario, i first create all the SharePoint groups which i’m using, then installed SharePoint Workflow Manager and performed following steps.

Step 1 – Export and Import All Required Libraries

Create your SharePoint Form/Document Library CMPs by using PowerShell EXPORT/IMPORT command as follows

Exporting from Source SharePoint Site

export-spweb -identity http://ServerName/site -path C:\LibraryName.cmp -itemurl /site/LibraryName/ -includeusersecurity

Importing to Destination SharePoint Site

Import-spweb -identity "http://ServerName/Site" -path "C:\CMPs\LibraryName.cmp" -force

Note: First Export all the Libraries from Source Server and then Import them on Destination server. as per my understanding from above command we cannot export import a List so i create STP in case of List instead of using above commands

Step 2 – Creating Package (WSPs) and Deploy workflows SharePoint Designer 2013

Open your SharePoint Site in SharePoint Designer 2013, select your workflow and click on Save as Template.

save as template

it will be saved in Site Assets Library of your SharePoint site, just download and save on your PC

site assets

Now its time to deploy All Workflow Templates to the Destination Server

Export Workflow as shown below

export wf

Deploy Workflow solution

Go to SharePoint Site Settings and make sure you are on Root Site, now click on Solution link.

Upload all workflow WSPs one by one and activate the solution

After a workflow solution has been activated for a site collection, it is available as a feature for all sub-sites. To activate the workflow feature for a sub-site, follow this procedure.

Activate the workflow feature
Open Site Settings on the site where you wish to activate the workflow feature.
In the Site Actions group, click Manage site features.
Click Activate next to the workflow feature as shown in the figure.

activate feature

NOTE: After activation of workflow feature, open SharePoint Designer now you will see your workflow will be created and you can use it.

For Ref: Click here

Step 3 – Publishing InfoPath Forms to Destination Server

Open your InfoPath form and CHANGE all the Data Connections in order to deploy on another server and make sure you didn’t wrote any server name hard coded in the form code.

after Publishing the form, it will be saved on your local system, NOW its ready to deploy on another server.

Note: in my case, i’ve all forms as Administrator approved templates with full trust

Deploy to Destination Server

Open Destination Server CA->General Application Settings->Manage Form Templates->Upload form template

after successful uploading, it will create a Site Collection feature and activate, associate with your SharePoint Library and add it as a Content Type.

For Ref – Click here

Note: in my case, it stuck in Installing or Upgrading so to remove it in order to upload it again use the following command

Uninstall-SPInfoPathFormTemplate -Identity "SampleTemplate.xsn"

after running above command i got following issue

The solution cannot be removed when a job is schedule or running

so to remove it forcefully, use the following STSADM Commands

stsadm -o enumdeployments
stsadm -o canceldeployment -id or stsadm -o execadmsvcjobs

stsadm -o canceldeployment -id 24bf35d4-5b96-4354-8d89-c4c8b7c539b6