Guys,
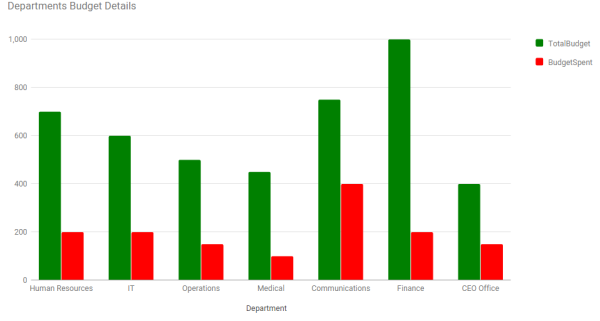
today i had also created a Bar Chart using Google API in SharePoint 2013 by creating a Custom WebPart.
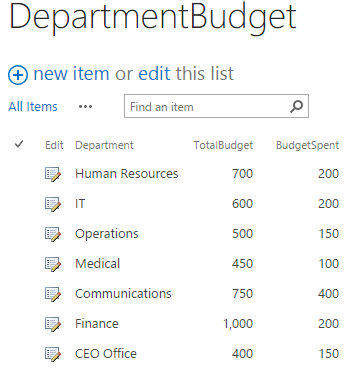
here is my custom SharePoint List (DepartmentBudget)
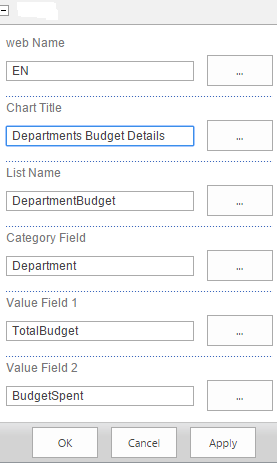
see the webpart Properties

BAR Chart
CSS class
.BarChartDepartment
    {
	 width:100%;
     height:500px;
     }
.ascx Page
<asp:Label ID="lblError" runat="server"></asp:Label>

<script type="text/javascript" src="https://www.google.com/jsapi?autoload={'modules':[{'name':'visualization','version':'1.1','packages':['bar']}]}"></script>
<div>
    <asp:Literal ID="ltrlScript" runat="server"></asp:Literal>
    <asp:Literal ID="ltrlCharts" runat="server"></asp:Literal>
</div>
.ascx.cs Page
#region All Custom Properties

        [WebBrowsable(true),
                  Category("Custom"),
                  Personalizable(PersonalizationScope.Shared),
                  WebDisplayName("web Name"),
                  WebDescription("web url")]
        public string webName { get; set; }

        [WebBrowsable(true),
                  Category("Custom"),
                  Personalizable(PersonalizationScope.Shared),
                  WebDisplayName("Chart Title"),
                  WebDescription("Title of the Chart")]
        public string ChartTitle { get; set; }

        [WebBrowsable(true),
                  Category("Custom"),
                  Personalizable(PersonalizationScope.Shared),
                  WebDisplayName("List Name"),
                  WebDescription("List name of department budget")]
        public string ListName { get; set; }

        [WebBrowsable(true),
                  Category("Custom"),
                  Personalizable(PersonalizationScope.Shared),
                  WebDisplayName("Category Field"),
                  WebDescription("Category Field Name")]
        public string CategoryField { get; set; }

        [WebBrowsable(true),
                  Category("Custom"),
                  Personalizable(PersonalizationScope.Shared),
                  WebDisplayName("Value Field 1"),
                  WebDescription("Field Name of which you want to generate chart")]
        public string ValueField1 { get; set; }

        [WebBrowsable(true),
                  Category("Custom"),
                  Personalizable(PersonalizationScope.Shared),
                  WebDisplayName("Value Field 2"),
                  WebDescription("Field Name of which you want to generate chart")]
        public string ValueField2 { get; set; }

        #endregion

		protected void Page_Load(object sender, EventArgs e)
        {
            try
            {
                if (!Page.IsPostBack)
                {
                    CreateDepartmentPieChart();
                }
            }
            catch (Exception ex)
            {
                lblError.Text = ex.Message;
            }

            this.ChromeType = PartChromeType.None;
        }

        private void CreateDepartmentPieChart()
        {
            SPListItemCollection itemsColl = GetAllItemsByBudget();
            if (itemsColl != null && itemsColl.Count > 0)
            {
                StringBuilder script = new StringBuilder();

                script.AppendLine("<script type=\"text/javascript\">");
                script.AppendLine("google.load(\"visualization\", \"1\", {packages:[\"corechart\"]});");
                script.AppendLine("google.setOnLoadCallback(drawChart);");
                script.AppendLine("function drawChart() {");
                script.AppendLine(" var data = google.visualization.arrayToDataTable([");
                script.AppendLine(" ['" + CategoryField + "', '" + ValueField1 + "', '" + ValueField2 + "'],");
                for (int i = 0; i < itemsColl.Count; i++)
                {
                    script.AppendLine(" ['" + itemsColl[i][CategoryField] + "', " + itemsColl[i][ValueField1] + ", "+ itemsColl[i][ValueField2] + "],");
                }
                script.AppendLine(" ]);");

                script.AppendLine(" var options = {");
                script.AppendLine("chart:{");
                script.AppendLine(" title: '" + ChartTitle + "'");
                script.AppendLine(" },");
                script.AppendLine(" bars:'vertical',");
                script.AppendLine(" vAxis:{format:'decimal'},");
                script.AppendLine(" colors:['green','red']");

                script.AppendLine(" };");

                StringBuilder chartDiv = new StringBuilder();
                chartDiv.AppendLine(" <div id=\"BarChartDiv_" + ValueField1 + "\" class=\"BarChartDepartment\" ></div>");
                script.AppendLine(" var chart = new google.charts.Bar(document.getElementById('BarChartDiv_" + ValueField1 + "'));");
                script.AppendLine(" chart.draw(data, google.charts.Bar.convertOptions(options));");
                script.AppendLine(" }");
                script.AppendLine(" </script>");

                ltrlCharts.Text = chartDiv.ToString();
                ltrlScript.Text = script.ToString();
            }
        }

        private SPListItemCollection GetAllItemsByBudget()
        {
            SPListItemCollection listItems = null;
            try
            {
                SPWeb currentWeb = null;
                if (!string.IsNullOrEmpty(webName))
                {
                    currentWeb = SPContext.Current.Site.AllWebs[webName];
                }
                SPQuery query = new SPQuery();
                SPList list = currentWeb.Lists.TryGetList(ListName);
                if (list != null)
                {
                    listItems = list.GetItems(query);
                }
            }
            catch (Exception ex)
            {
                throw ex;
            }
            return listItems;
        }
For Ref: Bar Chart
Tagged: bar chart, bar chart google api, bar chart in SharePoint, bar chart in sharePoint 2013, create bar chart sharepoint list, custom webpart bar chart, how to create bar chart


Leave a comment